Your OpenTelemetry Spans Aren’t Lost. Your Caller Told You Not to Record Them
Our API has OpenTelemetry tracing enabled. Requests sent directly using curl show up in the APM backend as expected. However, requests originating from two internal callers never generated spans, despite returning 200 OK and writing logs with trace IDs attached.
The issue was not the OTLP exporter, the collector, or network routing. The API received incoming W3C traceparent headers with the sampled flag set to 00. OpenTelemetry’s default sampler followed the specification and did not record. One caller received the 00 flag from a third-party proxy. The other had no tracing packages or configuration installed, but generated and forwarded 00 through default .NET runtime behavior.
Below is why .NET emits these headers by default, how the OpenTelemetry sampler handles them, and how to configure the receiving service to record the spans.
The Symptom
The API is an ASP.NET Core service on .NET 10. It registers the OpenTelemetry .NET SDK with instrumentation for ASP.NET Core, HttpClient, SQL, and the AWS SDK, exporting via OTLP to a shared collector. A filter drops health probes on / and /favicon.ico. No other endpoints are filtered, and no custom sampler was configured.
Two callers produced no spans:
- A Lambda-hosted .NET API behind a vendor’s proxy (Envoy with Datadog tracing).
- A .NET backend-for-frontend (BFF) for a single-page app with no OpenTelemetry packages and no tracing configuration.
Calls from both returned 200, and application logs reached the collector with trace IDs attached. Their spans never appeared in the APM backend.
The traceparent Header Format
The W3C Trace Context specification defines the traceparent header as four fields separated by hyphens:
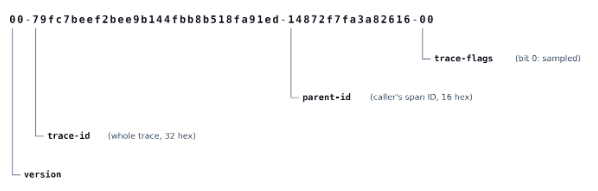
trace-id(32 hex characters): The distributed trace ID across all services.parent-id(16 hex characters): The caller’s outgoing span ID.trace-flags(8-bit byte): Bit 0 controls recording.01means sampled;00means not sampled.
Section 3.2.2.5.1 of the W3C spec
states:
“If a component needs to make a recording decision – it SHOULD respect the
sampledflag value.”
And when a component starts a trace:
“It should be set to
0as the default option when the trace is initiated by this component.”
When these two rules run across uninstrumented and instrumented services, downstream spans are dropped.
Testing the Flag with curl
Sending two requests with different flags isolates the behavior:
# Sampled flag (01)
curl -H "traceparent: 00-11111111111111111111111111111111-1111111111111111-01" \
  https://$API_URL/Version

# Unsampled flag (00)
curl -H "traceparent: 00-33333333333333333333333333333333-3333333333333333-00" \
  https://$API_URL/Version
Searching the APM backend for 11111111111111111111111111111111 returns the full trace. Searching for 33333333333333333333333333333333 returns nothing. The API drops spans on intake whenever the inbound flag is 00.
Logging Inbound Headers
To inspect what callers were sending, we added temporary middleware directly after builder.Build():
app.Use(async (context, next) =>
{
    if (context.Request.Path != "/")
    {
        var activity = System.Diagnostics.Activity.Current;
        app.Logger.LogInformation(
            "TraceContextDiagnostic: Path={Path} TraceparentHeader={TraceparentHeader} TracestateHeader={TracestateHeader} ActivityId={ActivityId} TraceFlags={TraceFlags} Recorded={Recorded} IsAllDataRequested={IsAllDataRequested}",
            context.Request.Path.Value,
            context.Request.Headers.TryGetValue("traceparent", out var tp) ? tp.ToString() : "(none)",
            context.Request.Headers.TryGetValue("tracestate", out var ts) ? ts.ToString() : "(none)",
            activity?.Id ?? "(none)",
            activity?.ActivityTraceFlags.ToString() ?? "(none)",
            activity?.Recorded,
            activity?.IsAllDataRequested);
    }
    await next(context);
});
Because application logs export independently of tracing spans, this captures the inbound headers for dropped requests.
Caller 1: Behind the Vendor Proxy
TraceparentHeader=00-000000000000000026a47f86228f14d9-17ccb071fcbd6cf5-00
TracestateHeader=dd=s:0;p:11096c07fe427b98;t.dm:-1
TraceFlags=None Recorded=False IsAllDataRequested=False
The top 64 bits of the trace ID are zeroed out (Datadog’s 64-bit ID format padded to 128 bits). The tracestate entry dd=s:0 is Datadog sampling priority 0 (drop), set by the proxy’s rate sampler (t.dm:-1). The vendor proxy sampled the request out, the Lambda forwarded the header, and our API honored the 00.
Caller 2: The Uninstrumented BFF
TraceparentHeader=00-79fc7beef2bee9b144fbb8b518fa91ed-14872f7fa3a82616-00
TracestateHeader=(none)
ActivityId=00-79fc7beef2bee9b144fbb8b518fa91ed-154cfc718e60171f-00
TraceFlags=None Recorded=False IsAllDataRequested=False
The trace ID is fully random across all 128 bits, which matches .NET’s ActivityTraceId.CreateRandom(). There is no tracestate. The BFF has no tracing packages installed, but the runtime generated and forwarded an unsampled W3C header anyway.
Why OpenTelemetry Drops the Trace
The OpenTelemetry SDK default sampler is ParentBased(root=AlwaysOn):
| Parent State | Default Delegate |
| None (root) | AlwaysOn |
Remote, sampled (01) | AlwaysOn |
Remote, not sampled (00) | AlwaysOff |
Local, sampled (01) | AlwaysOn |
Local, not sampled (00) | AlwaysOff |
A remote parent with flag 00 triggers AlwaysOff. The SDK creates an Activity so distributed context propagates downstream, but sets Recorded=False and IsAllDataRequested=False. The exporter ignores it.
Why Plain .NET Sends 00 Without Tracing Configured
Four runtime defaults combine to produce this:
1. ASP.NET Core creates an Activity when logging is enabled
In HostingApplicationDiagnostics.BeginRequest:
var loggingEnabled = _logger.IsEnabled(LogLevel.Critical);
if (ActivityCreator.IsActivityCreated(_activitySource, loggingEnabled || diagnosticListenerActivityCreationEnabled))
And ActivityCreator.IsActivityCreated evaluates:
return activitySource.HasListeners() || diagnosticsOrLoggingEnabled;
Because LogLevel.Critical is enabled in almost every app, ASP.NET Core creates an Activity for incoming requests even without an ActivityListener. This is why logs contain TraceId and SpanId in applications that do not use OpenTelemetry.
2. The ID format defaults to W3C
Activity.Start() falls back to DefaultIdFormat:
#if W3C_DEFAULT_ID_FORMAT
    s_defaultIdFormat = LocalAppContextSwitches.DefaultActivityIdFormatIsHierarchial ? ActivityIdFormat.Hierarchical : ActivityIdFormat.W3C;
#else
    s_defaultIdFormat = ActivityIdFormat.Hierarchical;
#endif
DiagnosticSource.csproj sets W3C_DEFAULT_ID_FORMAT for all modern .NET targets.
3. Trace flags remain zero
Flags are stored in a byte field defaulting to zero (ActivityTraceFlags.None):
private byte _w3CIdFlags;
With no inbound header, _w3CIdFlags stays 0. Without an ActivityListener callback returning AllDataAndRecorded, the flag stays unset. When serialized, Activity.Id renders as:
00-(traceId)-(spanId)-00
4. HttpClient propagates the Activity automatically
SocketsHttpHandler wraps calls in a DiagnosticsHandler:
[FeatureSwitchDefinition("System.Net.Http.EnableActivityPropagation")]
public static bool EnableActivityPropagation { get; } = RuntimeSettingParser.QueryRuntimeSettingSwitch(
    "System.Net.Http.EnableActivityPropagation",
    "DOTNET_SYSTEM_NET_HTTP_ENABLEACTIVITYPROPAGATION",
    true);
This switch defaults to true. DiagnosticsHandler creates a child Activity, inherits the None flags, and writes the traceparent header to outgoing HTTP requests.
The call chain:
- The browser calls the BFF with no tracing headers.
- The BFF starts an
Activitywith flagsNone(00). HttpClientsends00-traceid-spanid-00to downstream services.- The receiving API’s
ParentBasedsampler sees00and drops the span viaAlwaysOff.
Configuration Fix
Configure the receiving service to record incoming requests even when an upstream remote parent arrives marked 00:
Option 1: Configuration via OTEL_TRACES_SAMPLER
Set the sampler in environment variables or appsettings.json:
OTEL_TRACES_SAMPLER: always_on
Option 2: Configuration in Code
To set the sampler in application startup, configure the tracer builder:
builder.Services.AddOpenTelemetry()
    .WithTracing(tracing => tracing.SetSampler<AlwaysOnSampler>());
Any sampler set directly in code takes precedence over configuration files and environment variables. If both exist, the SDK ignores OTEL_TRACES_SAMPLER and writes an override diagnostic message only to its internal EventSource.
What happens after this change:
- Trace ID is preserved: The span attaches to the caller’s trace ID. If the caller starts recording later, the traces line up.
- Downstream headers become
-01: Once the service records, its outgoing calls set bit 0 on downstream requests, enabling tracing for subsequent hops. tracestatepasses through: Upstream vendor state likedd=s:0remains intact.- Callers are unaffected: Decisions only travel downstream.
Trade-Offs
If every service in your architecture is instrumented and an edge gateway handles head sampling, respecting the caller’s 00 flag prevents broken traces and manages ingest volume.
In systems that mix third-party proxies, uninstrumented apps, and multiple frameworks, an incoming 00 usually means nobody made a sampling decision, not that a service chose to drop the trace. Overriding remoteParentNotSampled at your service boundary and using tail sampling in the collector avoids losing visibility to runtime defaults.
Other Options
- Instrument the caller: Adding OpenTelemetry causes the caller to record and propagate
-01directly. This will not help when the caller forwards a00from an external proxy. - Disable caller propagation: Set
DOTNET_SYSTEM_NET_HTTP_ENABLEACTIVITYPROPAGATION=0or setDistributedContextPropagator.Current = DistributedContextPropagator.CreateNoOutputPropagator()on the caller. The API then starts a fresh trace ID, but you lose trace correlation across the hop.
Diagnostic Checklist for Missing Spans
- Check if application logs reach the collector. If logs arrive and spans do not, your network and collector pipelines are operational.
- Send two
curlrequests to the endpoint, one with-01and one with-00. Search for both trace IDs. - Log inbound headers with diagnostic middleware (
traceparent,tracestate,Activity.Recorded). - Read the incoming trace ID:
- 64-bit padded trace ID with
dd=intracestate: Datadog proxy or agent dropped the trace. - 128-bit random trace ID with no
tracestate: Default .NET runtime propagation from an uninstrumented service.
- 64-bit padded trace ID with
- Set
remoteParentNotSampled: new AlwaysOnSampler()on receiving APIs.
References
- W3C Trace Context Specification: Sampled Flag
- OpenTelemetry SDK Specification: ParentBased Sampler
- Microsoft Learn: ActivityTraceFlags Enum
- Microsoft Learn: HTTP Activity Propagation Runtime Configuration
- dotnet/aspnetcore: ActivityCreator.cs
- dotnet/runtime: Activity.cs
- dotnet/runtime: SocketsHttpHandler.cs
This entry was posted on Friday, October 2nd, 2026 at 8:14 am and is filed under .NET. You can follow any responses to this entry through the RSS 2.0 feed. You can leave a response, or trackback from your own site.

